Introduction
The most common approach to energy consumption modeling for M&V is to decompose energy consumption into two components:
- One for the time-dependent operational effects, represented by time-of-week indicators, and
- One for the weather-dependent effects, represented by temperature response functions.
Time-of-week effects capture recurring operational schedules that may reflect time-varying occupancy, equipment operation, and control strategies, all of which may not be directly observable. Weather sensitivity is incorporated through temperature-based regressors that are non-linear or piecewise linear functions of the outdoor air temperature. It is conceptually straightforward to imagine that the time-of-week component aims at approximating a hidden variable that reflects variations in the activity levels inside a building. In this case, outdoor temperature directly affects energy consumption for heating and cooling, while activity directly affects consumption by reflecting operations and time-varying levels of occupancy. Calendar features like the time-of-week are proxies of the hidden activity levels that are correlated to both temperature and indoor operations.
This article presents the typical approach to modeling for M&V along with how the Meval methodology deconstructs this approach, as well as a proposal for the way the whole M&V task should be regarded.
Use Case
We will use the open dataset that accompanies the paper Dataset on occupant behavior, indoor environment, and energy use before and after dormitory retrofit and, in particular, the data for the building numbered 2.
This dataset inludes data capturing occupant behavior of students living in residential dorms at a university in Syracuse, New York, USA, collected both before and after a complete building envelope and energy retrofit. We will use the outdoor air temperature and HVAC energy consumption. For pre-retrofit, this would be the HVAC energy usages from all baseboards in all zones. For post-retrofit, it would be the HVAC energy usages from the installed heat pumps and the baseboards combined.
Following the standard M&V for hourly data, we can use the pre-retrofit (baseline) data to train a predictive model that maps the outdoor air temperature and calendar features such as the hour of week and week of year to the observed energy consumption. To avoid overfitting, we can represent calendar features as Fourier features, so that we can cover the whole year with fewer features by exploiting seasonality. The following card summarizes the model's performance metrics:
CVRMSE
Coefficient of Variation of Root Mean Squared Error
50.7%
Lower values indicate better model fit
NMBE
Normalized Mean Bias Error
-0.270%
Measures systematic prediction error
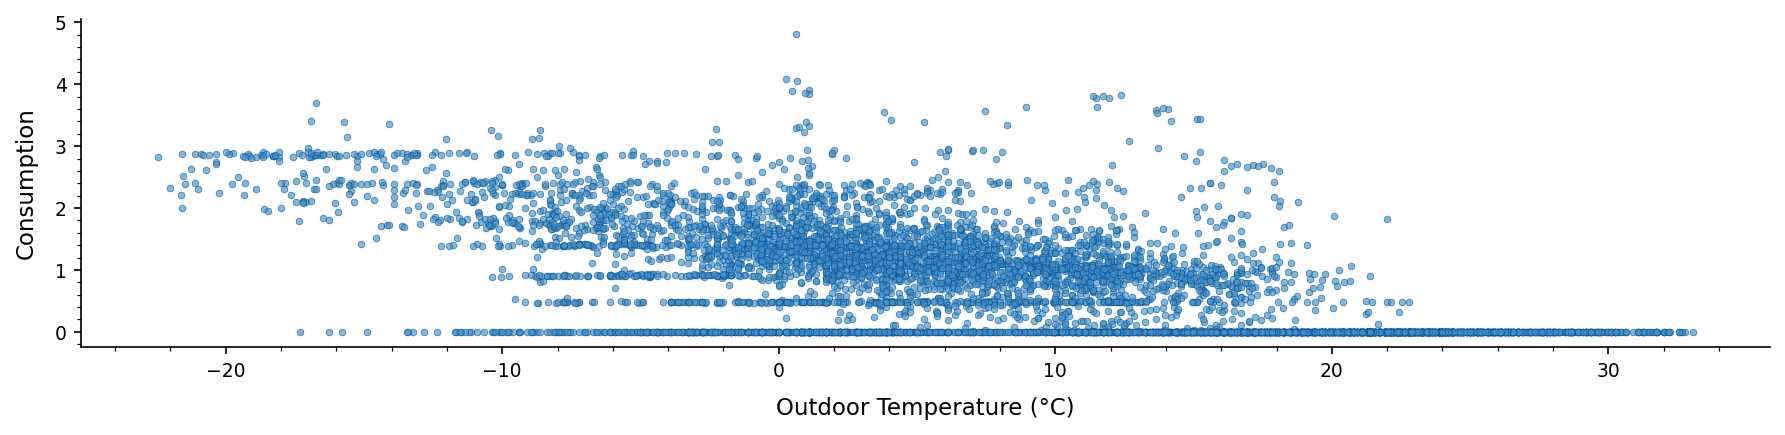
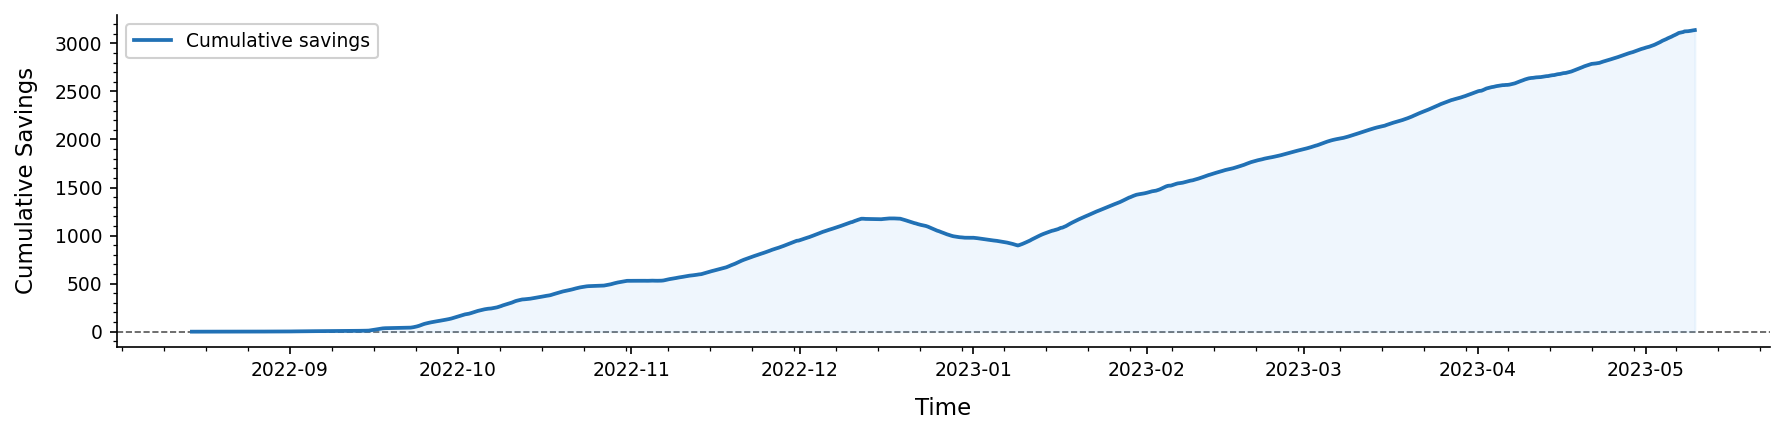
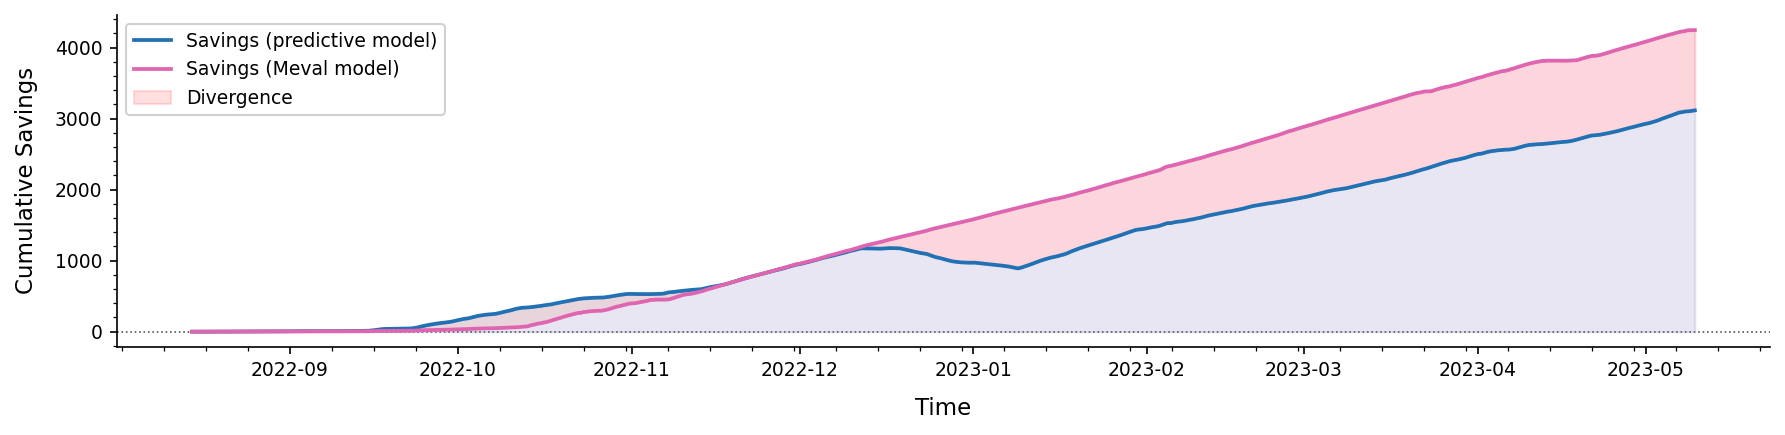
Next, the predictive model is applied on the post-retrofit data. The plot of the top shows the the post-retrofit energy consumption, while the plot on the bottom shows the estimated cumulative savings over time.
The Meval Approach
Meval is based on the idea that the M&V goal is fundamentally a goal of devising and applying a mapping from states and conditions after an energy efficiency intervention to states and conditions before it. The impact of the intervention is the difference in energy consumption between matching states and matching conditions. When M&V is perceived as a mapping task, information extracted from the observed energy consumption during the reporting period can be used to improve the estimation of the energy savings.
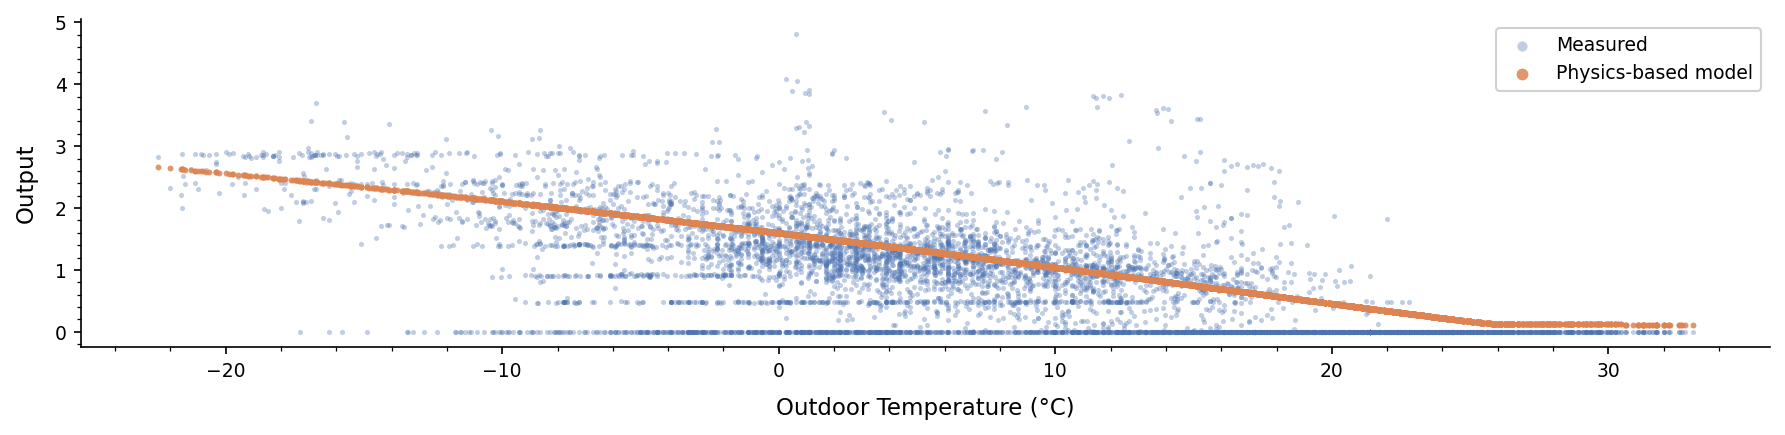
During the baseline period, Meval jointly fits a physics-based model and a model that uses calendar features to map the deviations around the physics-based model to a hidden variable called activity. In this way, the physics model reflects the average energy consumption at a given outdoor temperature, while activity reflects relative deviation from average.
The physics-based model is capable of detecting thermal inertia, free-cooling operation and capacity saturation, but for this dataset, it's output looks like a piecewise linear regression (which will make comparisons much easier):
The Meval model regularizes activity based on how strong the link between activity and calendar features seems to be. It also uses activity as a feature in place of the calendar features. As a result, and in terms of predictive capability, it is similar to a typicall predictive model when calendar features are not very useful, but better when they are.
CVRMSE
Coefficient of Variation of Root Mean Squared Error
47.2%
Lower values indicate better model fit
NMBE
Normalized Mean Bias Error
0.060%
Measures systematic prediction error
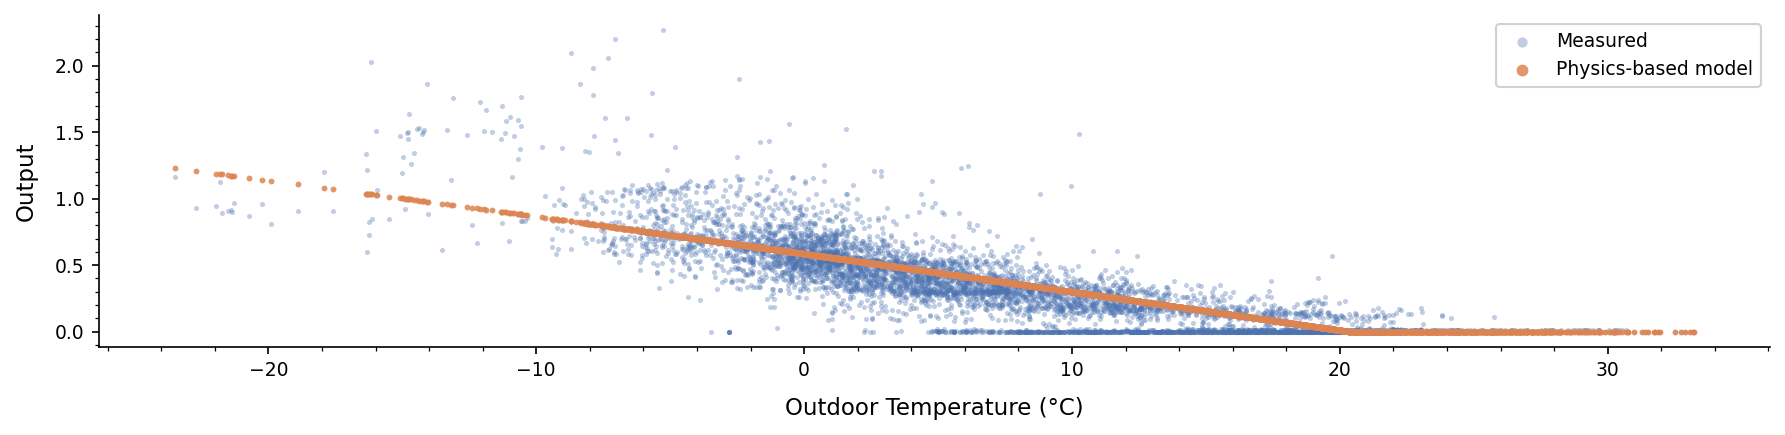
During the reporting period, a new physics-based model is fitted on post-retrofit data. The estimation of the activity follows the same approach with an additional assumption: the joint distribution of activity and outdoor temperature is assumed to be stable before and after the retrofit. This assumption is not arbitrary, but reflects a fundamental requirement for data-based M&V whatever the chosen method for estimating the counterfactual energy consumption is:
Indoor activity levels are invariant to the retrofit
The retrofit changed efficiency (temperature response), not occupant behaviour or operations.
Implications
For a given outdoor temperature, the distribution of the activity should be the same pre- and post-retrofit
If this assumption does not hold at least for a period after the retrofit that would allow the quantification of what actually changed in the building's systems, there is an identifiability problem: activity shifts will mask the effect of the upgrade. Here, activity shifts are defined as changes in the way an existing system is used (such as a different number of heating/cooling hours) or changes in the context of the system's operation (such as a higher or lower number of occupants during peak hours).
The physics-model that was trained on the post-retrofit data shows a reduction in the effective sensitivity of the energy consumption to outdoor temperature of 52%. This is close to the paper's estimation of 57.74% (estimated as Heating Degree Day-normalized HVAC energy usage before and after the retrofit)
Meval estimates energy savings by comparing the outputs of the pre- and post-retrofit physics-based models augmented by an activity feature that maps the activity levels after the retrofit to similar levels before. In this way, calendar features never cross from pre- to post-retrofit data, but they are lifted to the activity domain, which is comparable pre- to post-retrofit.
Let's compare the cumulative savings:
Which Approach Better Approximates the Retrofit Impact?
Since Meval does not allow calendar features to cross from pre- to post-retrofit data, it can capture energy savings that stemp from an upgraded HVAC system being used more often. The yearly total heating hours before the upgrade were 3,893, while after the upgrade 4,477, so maybe this is the case here.
To test this hypothesis, we can "cheat". In particular, we can create a new feature called schedule. It is a binary feature that is zero for all observations with zero energy consumption and one otherwise. We have access to both pre- and post-retrofit energy data, so we can create this feature for both periods. Then, we can train a predictive model on baseline data (including schedule) and apply it on the reporting period's data. This is how this model compares to Meval:
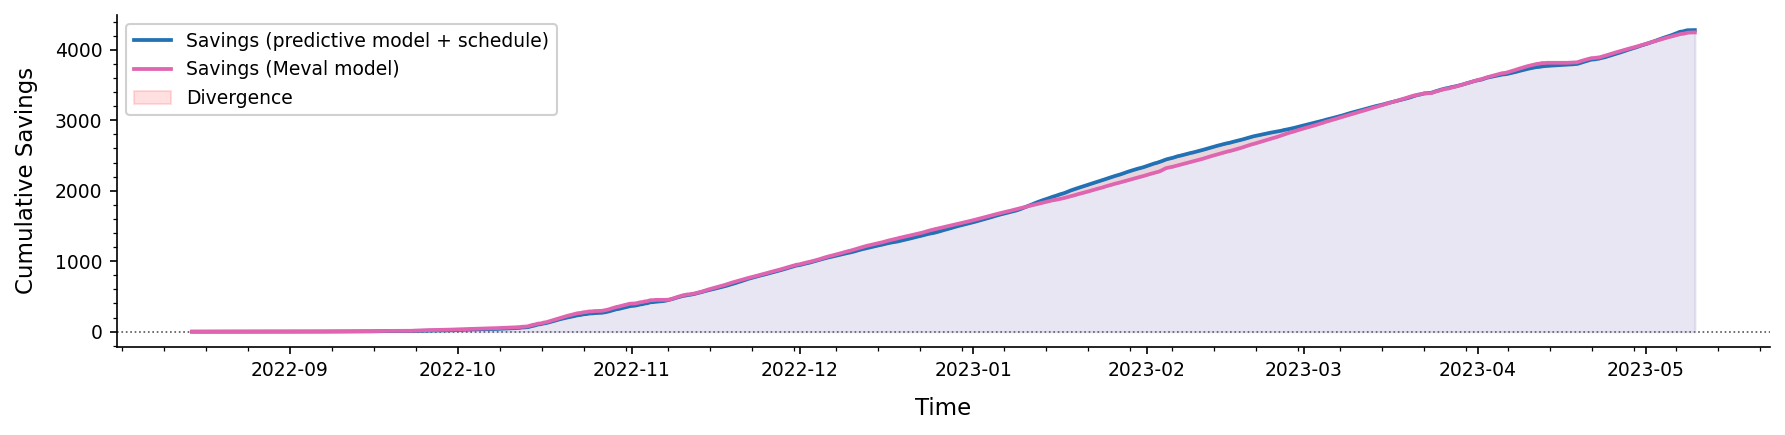
But did we actually cheat when adding schedule as a feature? If you regard M&V as a prediction task, yes we did (we did what is formally called data leakage). While prediction tasks have favourable properties when it comes to testing and evaluating their accuracy, they typically include the following steps:
- Use historical data to train a predictive model
- Apply the model to get predictions for one of more time steps ahead
- Evaluate the accuracy of the model when receiving new data (by comparing the observed data to the predictions)
- Re-train or fine-tune the model using the newly received data.
This workflow is different from the workflow for M&V, primarily because in the M&V case, the true values for the counterfactual prediction are never observed. As a result, it is much more difficult to update the predictive model so that it remains relevant. But if we regard M&V as a task of devising and applying a mapping from states and conditions after an energy efficiency intervention to states and conditions before it, creating and using a feature such as the schedule makes perfect sense.
Prediction alone makes M&V more difficult than it already is
A powerful framework for M&V is created by extracting information from both pre- and post-retrofit data, and applying a mapping from states and conditions after the intervention to states and conditions before it. Then, the impact of the intervention is the difference in energy consumption between matching states and conditions.
Implications
Meval offers an alternative methodology for advanced M&V that can overcome the limitations of the standard, pure prediction-based approach.